Overview
Workday is the system a large company uses to pay people, track time off, hire and report on its workforce, which means people with disabilities use it every week. The accessibility team had a practical question. AI was making new kinds of help possible, like describing a chart to someone who can’t see it or captioning a meeting live, but the market was crowded and changing monthly. Where should Workday use AI first, and should it build those features or partner with someone who already had?
Our team of four interns worked on that question with Workday for 12 months. I led the research into the solutions. Once we had a recommendation I wrote the rollout plan for each option, a roadmap for when to do what, and a set of practices for how Workday’s accessibility AI team should build with AI.
The brief and how we ran it
We agreed five goals with Workday at the start: understand the accessibility technology market, line it up against Workday’s strategic objectives, build a market map in Figma in the style of a CB Insights map, run a trade study of AI accessibility options, and identify strategic opportunities for Workday.
The 12 months fell into five stages, each feeding the next.
- 1FrameAgree goals, split users into four groups, write the job each group needs done
- 2MapFind every relevant company, product and research group; build the market map
- 3ScoreRate each shortlist on the same five criteria
- 4Deep-diveCompare the leaders in each group, including pros, cons and risks
- 5RecommendChoose partners, then write the rollout plan, roadmap and AI development practices
I kept regular check-ins going with Workday’s design, engineering and leadership contacts and presented to leaders and customers along the way, so the final recommendations didn’t land as a surprise.
Problem and research
Starting from people, not technology
The first thing we did was resist the urge to list vendors. We split accessibility into four groups of users and wrote down, for each, the job they need done and what has to be true for software to do it. It stopped us chasing whichever model was newest and gave Workday a way to compare options that wasn’t about features.
Understand charts, dashboards and documents without sight
A person who is blind or has low vision
Control devices and complete tasks independently with limited mobility
A person with a motor impairment
Follow meetings and calls with accurate real-time transcription in many languages
A hard-of-hearing employee
Process dense information; find work that fits cognitive strengths
A person with dyslexia, ADHD or autism
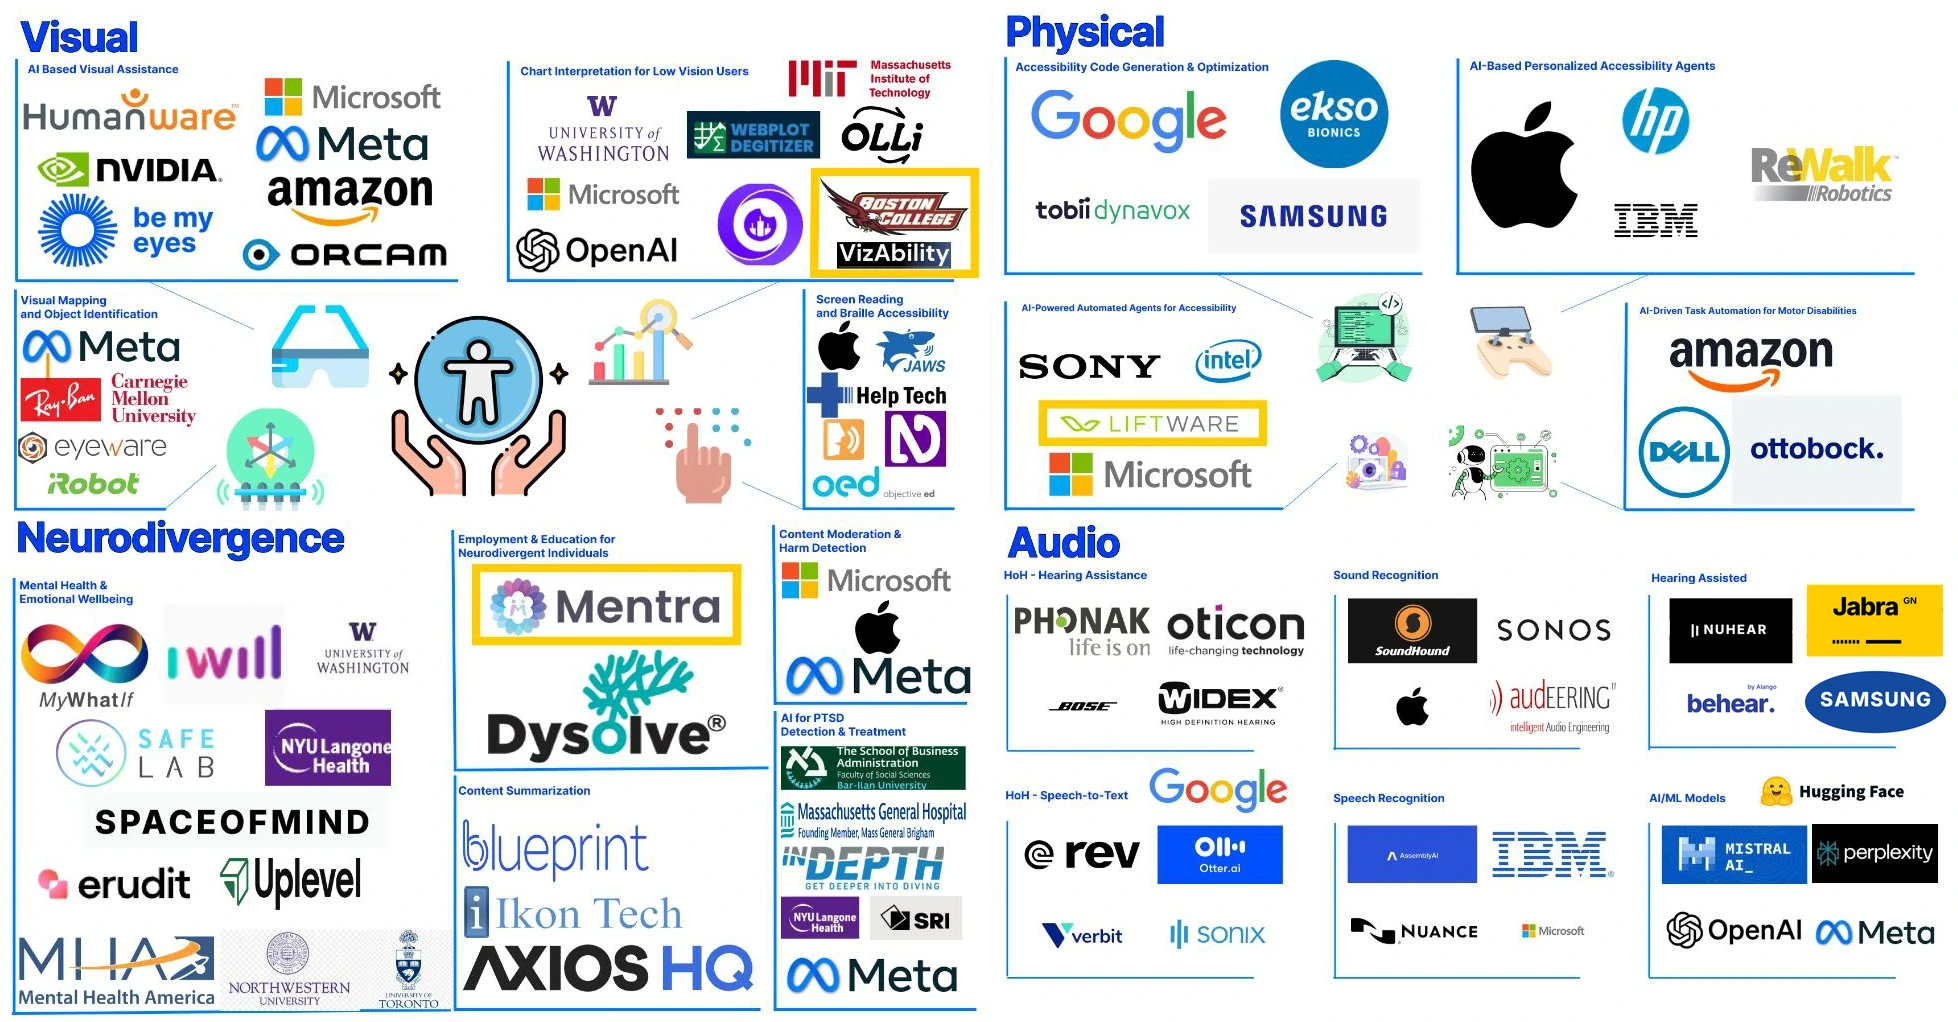
These are the options that reached the detailed trade study; the full map covered 50+.
When I interact with visual charts, I want access to accurate, detailed descriptions and alternative ways to understand the data, so that I can make informed decisions without needing to rely on visual modalities.
Problem statement, visual group
Scoring more than 50 vendors
The market map was the first big deliverable. We found companies, products and research groups in each of the four groups, from large technology firms to university labs and small startups, and sorted them by the kind of help they offered. Then we had to compare them fairly, which was harder.
Every shortlist was rated on the same five criteria:
| Criterion | Why it matters | What we looked for |
|---|---|---|
| Feature success rate | Accessibility users rely on the output, and a wrong answer harms them | Published accuracy, benchmarks, hands-on testing |
| Daily and monthly active users | Evidence that real people adopt it | Usage, retention signals, customer references |
| Integration compatibility and time | Engineering cost and fit with Workday’s platform | APIs, data flows, security review effort, estimated weeks |
| Feature latency | Real-time jobs like captions break when they lag | Response time under realistic load |
| Prototyping potential | Can we test it with users in weeks, not quarters? | Sandbox access, licensing, partner willingness |
We showed the result as a table of partial-fill circles, one row per product and one column per criterion, so a busy executive could read a shortlist at a glance. Where scores were close, the difference was in the details, so we ran deep-dives on the leaders.
What we found in each group
Visual: chart interpretation. We chose chart interpretation as the focus because charts are common in business reporting, and they are one of the places screen readers struggle most. Any solution has to do three things: convert a chart in any format into data points, answer the user’s questions and draw insights from the data, and communicate the answers in a non-visual way.
Two approaches stood out. VizAbility, a research tool from Boston College, is fully integrated and had a high success rate with accuracy fairly even across chart types, and it follows standard accessibility principles. The downsides were that its white paper doesn’t say which language model it uses, it only works with JavaScript chart libraries, and it has trouble classifying contextual questions. The other approach was to pair the open-source WebPlotDigitizer with a language model. That works on every chart type and format, is completely open source, and its LLM integrations were in development, but there was little performance data, many chart types needed manual setup, and the current version needed us to integrate a language model ourselves. Build versus buy was a real trade-off here.
Physical. The job here is to let people control devices and finish tasks without help. We looked at hands-free control (Microsoft Eye Control, which uses eye tracking and has large-scale adoption) and at task automation for people with motor impairments (Liftware, which personalises help with daily routines). We paired them because one changes how a person interacts and the other reduces how much they have to do.
Neurodivergent. We assessed two products with very different risk profiles. Axios HQ uses AI to turn dense information into a short, digestible format, which could help people with dyslexia, but private internal memos might surface across the platform. Mentra matches neurodivergent people with jobs in tech that suit their strengths, but many people are not comfortable telling their employer about a neurodivergence.
Hearing. Hard-of-hearing users need accurate real-time transcription in many languages. Manual and semi-automated services exist, but they’re limited in accuracy, reliability and supported languages. Our standout was an open-source agentic framework from Hugging Face, which benchmarked at 90%+ lower cost than enterprise models on tasks like transcription. We also assessed AssemblyAI’s audio-intelligence APIs, which are strong on detecting key attributes of transcribed content. That cost gap changes the build-or-buy answer for this group, which is why it sits further down the roadmap while we verified accuracy and latency.
Solution
The recommendation
Out of more than 50 vendors we surfaced 8 partnerships worth pursuing and recommended three to start with: VizAbility for chart descriptions, Mentra for strengths-based job matching, and Liftware for people with limited mobility. We put these three first because they scored well on the criteria and could each be piloted without a large integration project.
Rollout plan and roadmap
For each partner I wrote how to start, a success measure and a condition that has to be true before going further.
| Partner | How to start | What has to be true before scaling |
|---|---|---|
| VizAbility | Pilot chart descriptions in reporting with screen-reader users | The vendor discloses its model, and descriptions are accurate on Workday’s own chart types |
| Mentra | Opt-in matching inside recruiting | Candidates control whether and when anything is disclosed |
| Liftware | Research partnership on device and task automation | A co-development scope both sides agree on |
| Open-source transcription | Side-by-side test against AssemblyAI | Meets latency and accuracy targets in real meetings |
How the team should build with AI
The last piece covered how Workday’s own accessibility AI product team should work, so the plan didn’t depend on us being in the room. I wrote it as six practices, in the order a feature moves from idea to release.
- 1Bring users in earlyPeople with disabilities in discovery, not only in testing
- 2Agree the measuresTask success, accuracy, latency and WCAG conformance
- 3Test before releaseAccuracy sets per input type; review of failure cases and bias
- 4Build in the safeguardsModel and data disclosure, privacy review, opt-in, a human fallback
- 5Roll out in stagesFeature flags, pilot groups and clear rollback triggers
- 6Keep watchingUsage data and user feedback; a regression blocks the release
The risks we wrote down next to each option
Responsible AIDoesn’t disclose its model and only supports JavaScript chart libraries. We made disclosure and accuracy on Workday’s chart types conditions of the pilot.
Many people don’t want their employer to know they are neurodivergent. Opt-in only, with the candidate in control.
Its summaries could help readers with dyslexia, but private memos might surface across the platform. Not recommended without data isolation.
Much cheaper, but needs more setup and integration. Test against latency and accuracy targets before committing.
Results
What happened
Over the 12 months we presented the work to Workday’s design, engineering and executive leaders and to customers, with the market map, the trade study, a partnership evaluation matrix, a research report and the recommendation. It informed the direction of Workday’s accessibility AI roadmap, and the full deck is linked at the top of this page.
Looking back
- Scoring every option on the same five criteria is what made 50+ vendors comparable. It also made the recommendation easy to challenge, which leadership wanted.
- Listing each option’s risks next to its benefits mattered as much as the scores. An AI feature that’s confidently wrong is worse than none for these users.
- Presenting along the way meant the final recommendation came with support already behind it.
- I would build a rough prototype of the top option during the research next time, to check the integration estimates before recommending it.