Platform · Outcomes dashboard
Length of stay and excess days against your own baseline
The outcomes dashboard compares each unit with its own baseline, adjusted for case mix. Length of stay, excess days, rehab acceptance, use and projected savings sit in one place, with the method on the page.
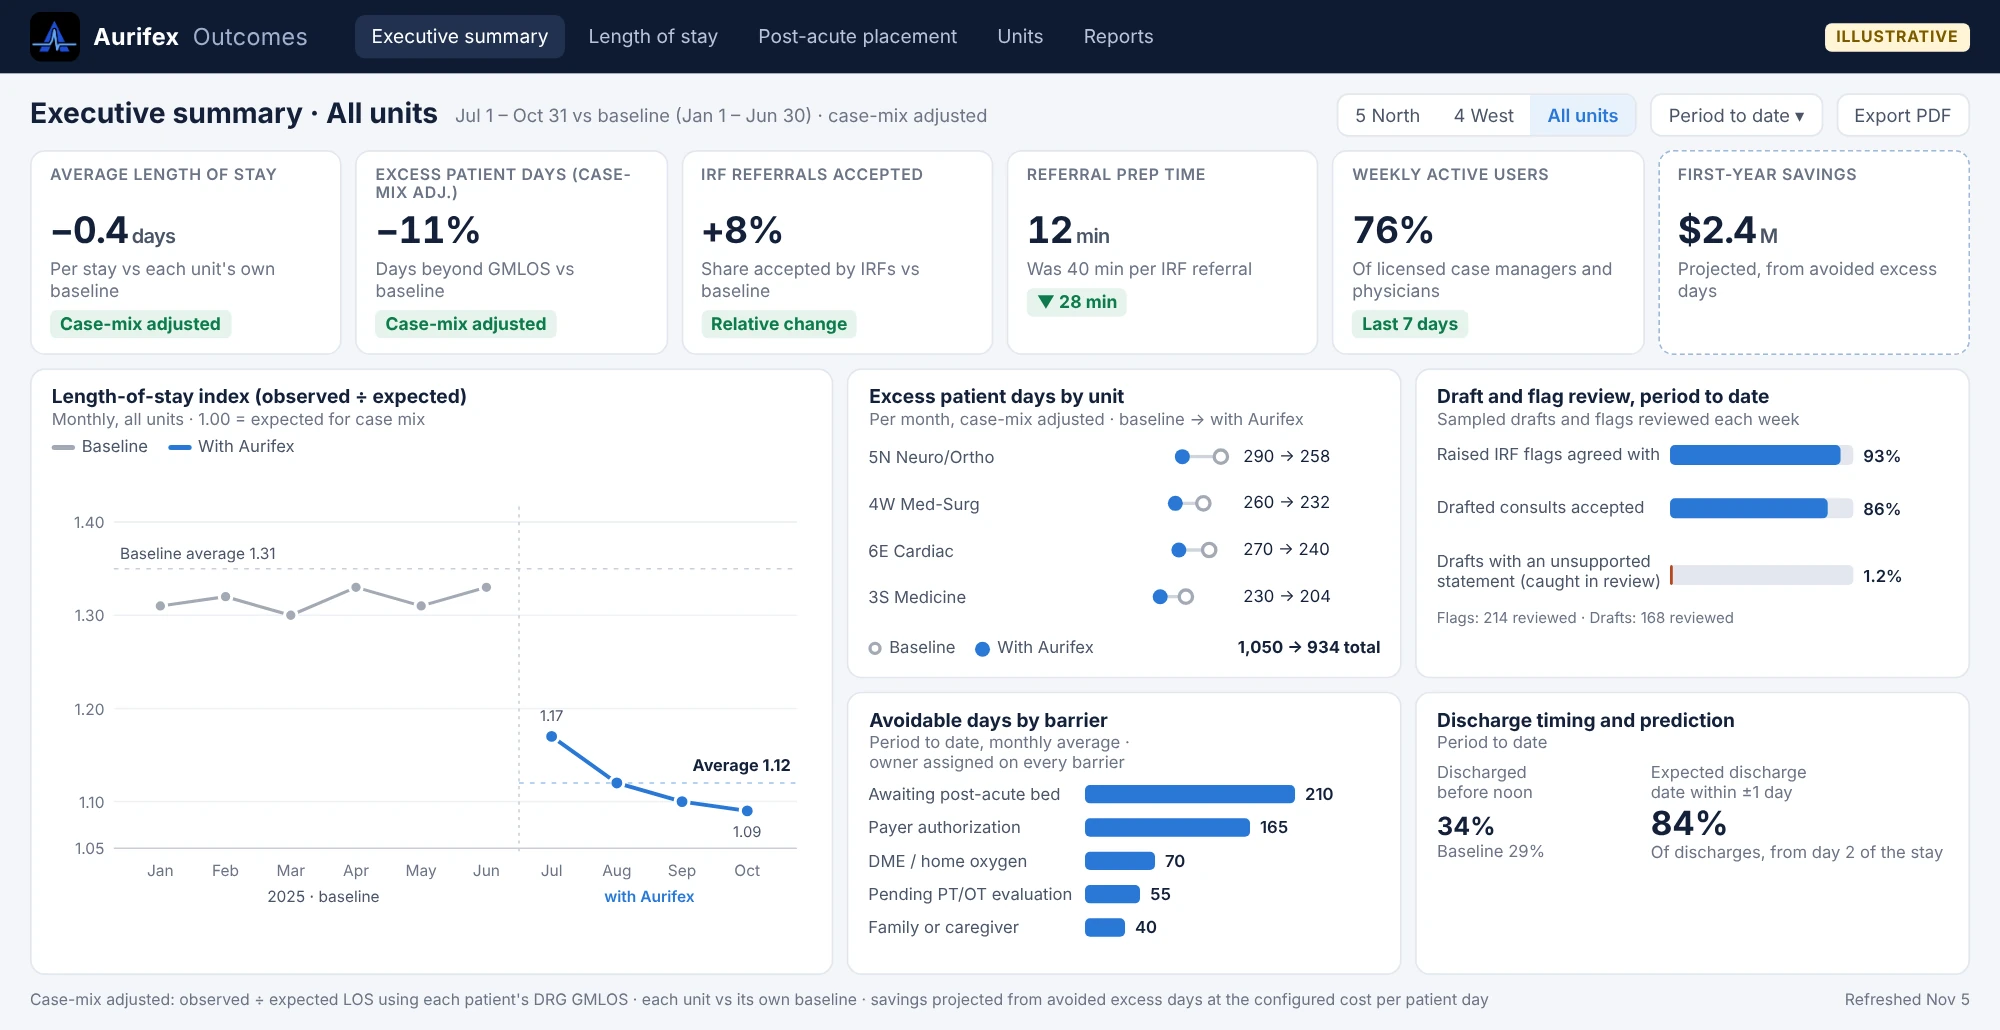
What it shows
Executives and finance leaders need a short answer to one question: is this shortening stays, and by how much?
| Measure | What it tells you |
|---|---|
| Average length of stay and LOS index | Whether stays are shorter than before, and than expected for the case mix |
| Excess patient days | Days beyond the expected length of stay for each patient's diagnosis, case-mix adjusted, by unit |
| IRF acceptance rate | The share of rehab referrals accepted by an IRF, from flag to acceptance |
| Referral prep time | Minutes a case manager spends preparing a rehab referral |
| Use | Clinicians and case managers active each week on the units |
| Balancing measures | 30-day readmissions and returns to the emergency department, so shorter stays aren't bought with returns |
| Avoidable days by barrier | Where the remaining days are lost, so the next fix is clear |
| First-year savings | Avoided excess days valued at your cost per patient day, always labeled projected |
How the baseline is set
Comparing one hospital with another hides too much. The dashboard compares each unit with the same unit before Aurifex.
- Baseline period. Agreed at kickoff, usually the months just before go-live, on the same units.
- Case-mix adjustment. Each stay is compared with its expected length of stay from the DRG GMLOS, so a sicker or healthier group of patients doesn't flatter or hide the result.
- Same definitions throughout. The definitions are fixed before go-live and printed with the results.
Projected and realized, kept apart
Savings come from fewer excess days valued at your own cost per patient day. Until your finance team confirms them in the books, they're shown as projected, with a dashed border and a label.
Filters, exports and access
- Filters. By hospital, unit, payer and month, from the latest month back to baseline.
- Exports. To PDF for committee and board packets.
- Fairness view. The same measures across patient groups.
- Aggregate only. Leaders see totals and rates. Patient-level detail stays in Epic, behind your existing access controls.
The dashboard runs on a separate, single sign-on reporting site, so leaders don't need Epic access to see results.
Evaluation results
The dashboard is how results are reported on your own units. Here's what testing shows:
| Result | Value |
|---|---|
| Discharge dates within one day, in testing | 85%+ |
| Rehab-candidate flag: AUROC, in testing | 0.91 |
| Drafted consults rated acceptable, in testing | 85% |
| Hallucination rate (per statement), in testing | 1.5% |
| Minutes per IRF referral (simulated cases), in testing | 45→10 min |

See Aurifex on your own discharge workflow
We'll walk through your worklist, a drafted referral and how a pilot would be measured on your units.