
Product tour
Six screens, from a worklist flag to the board report
The six screens case managers, physicians, unit leaders and executives work in. Select a step.
Step 1 of 6 · Case managers
The worklist
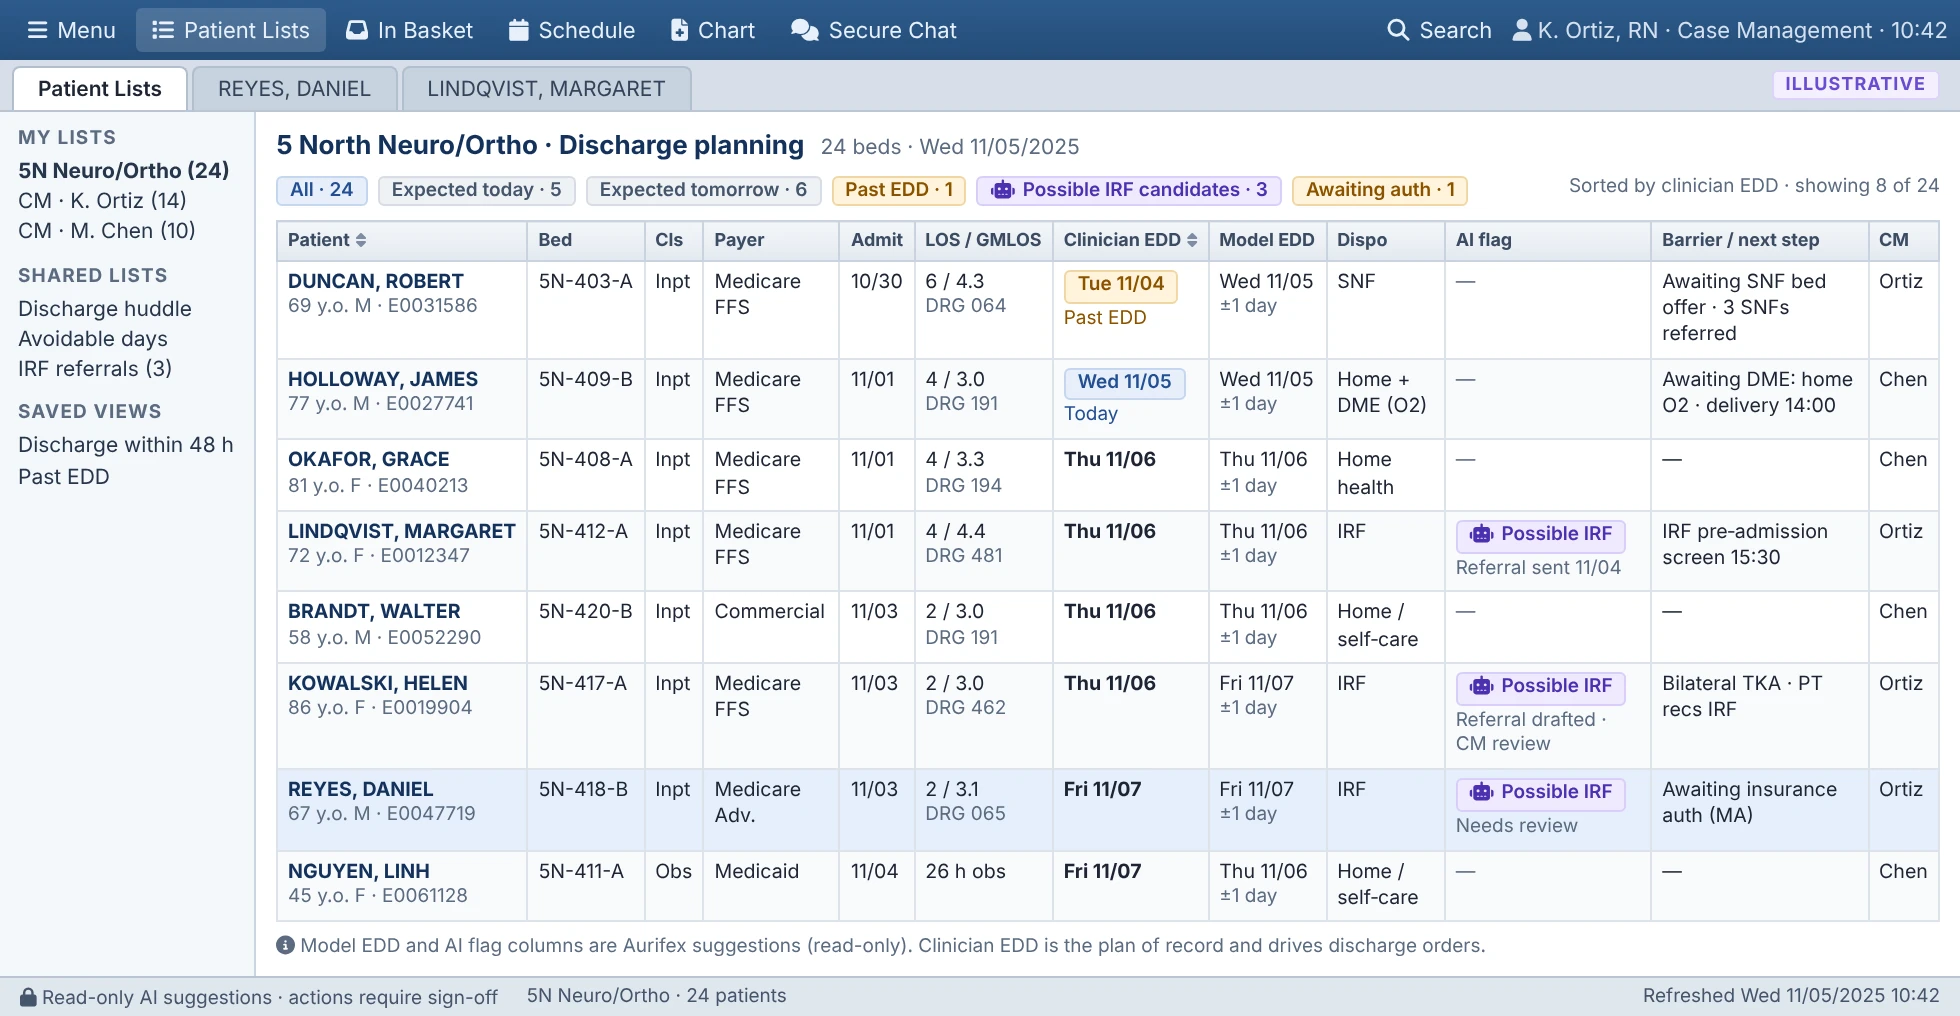
The morning starts in the case-management worklist your team already uses. Aurifex adds its columns beside yours.
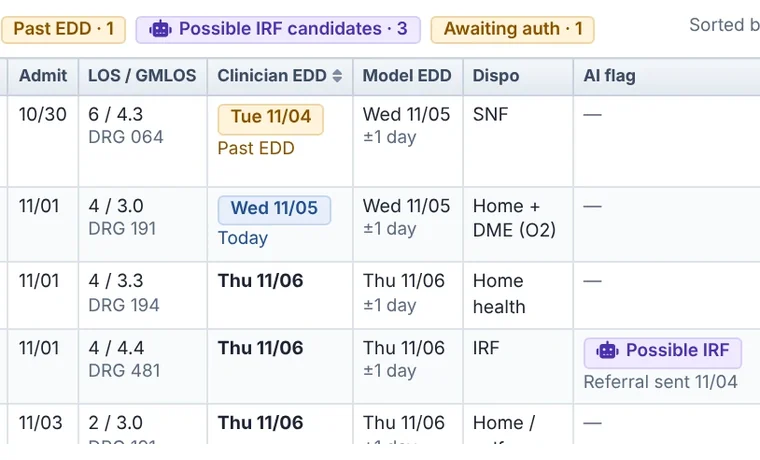 Model expected discharge date. Never overwrites the clinician's date.
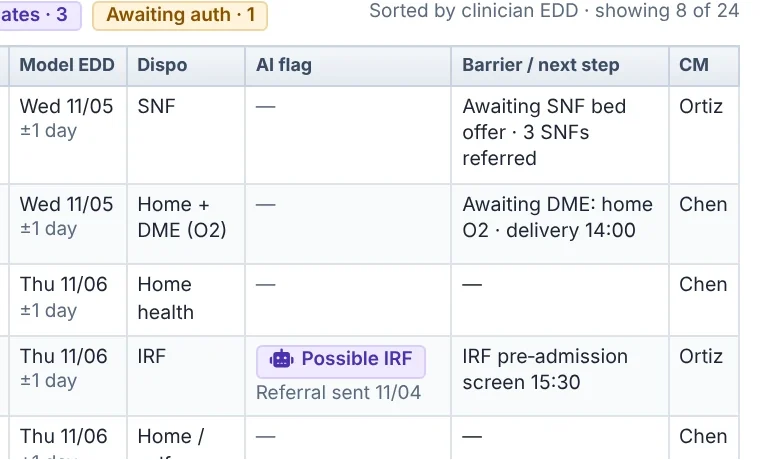 Barrier and next step.
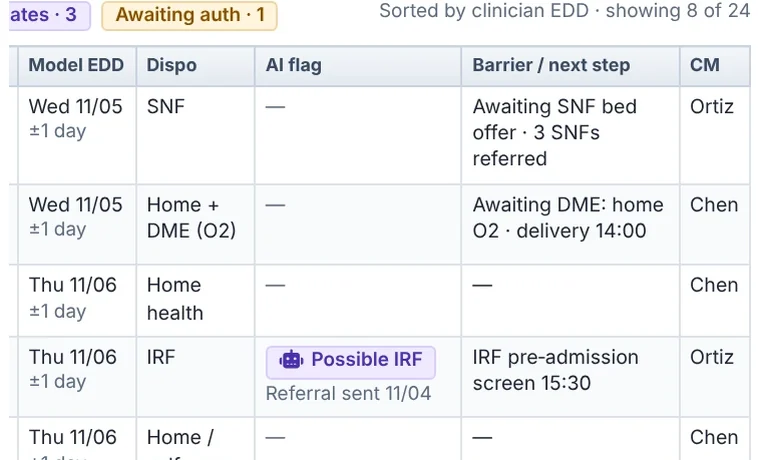 Possible IRF flag, with referral status below.
Step 2 of 6 · Case managers and physicians
Candidacy review
Opening a flagged patient shows a cited summary and the CMS IRF criteria with the evidence found in the notes.
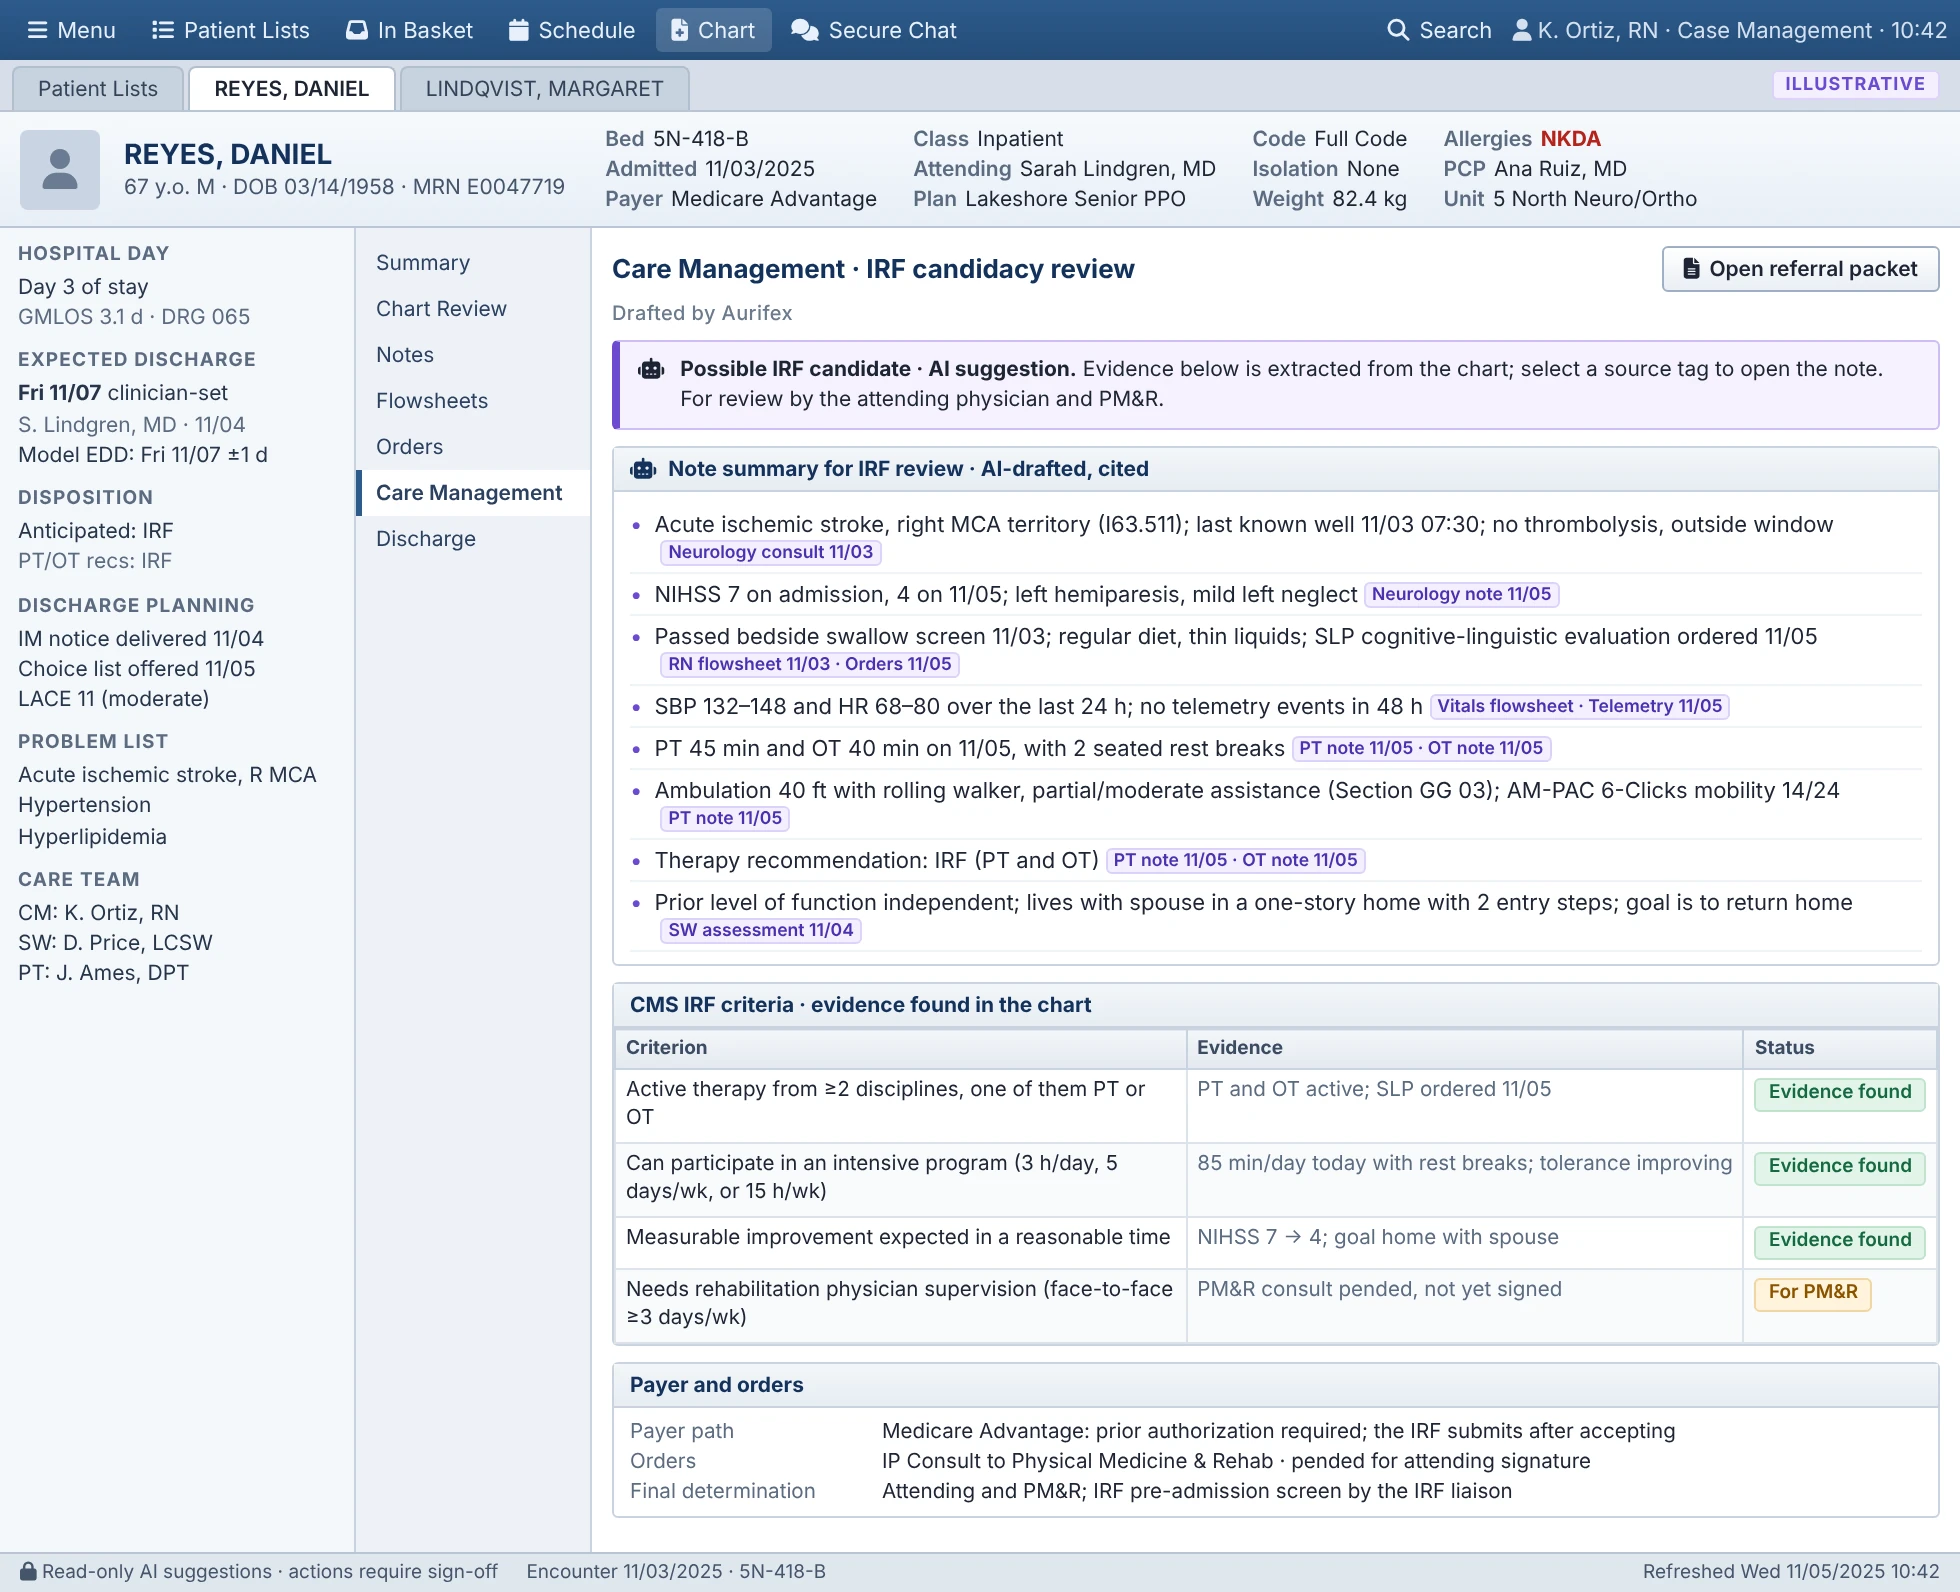
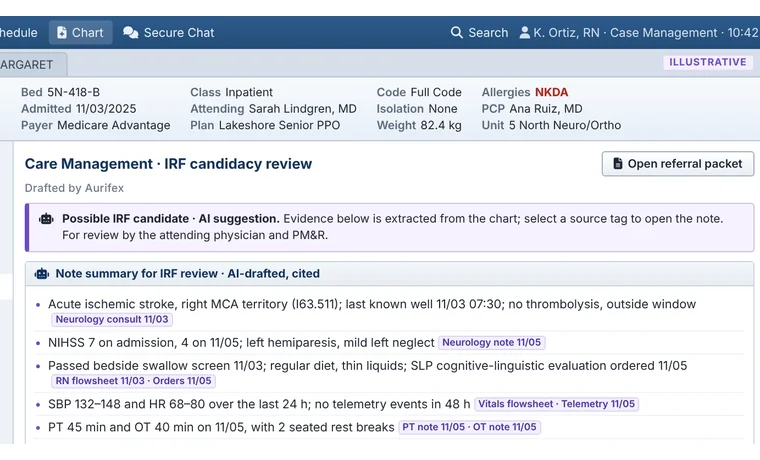 A suggestion, clearly labeled. The physician and PM&R decide.
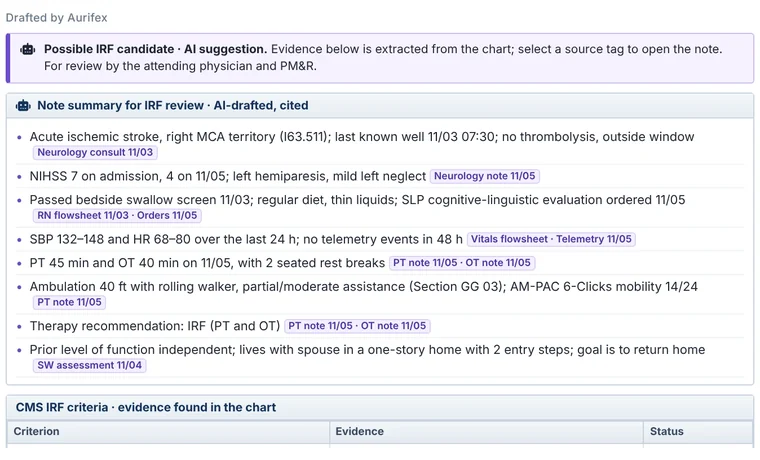 Every line cited. Each statement links to its note.
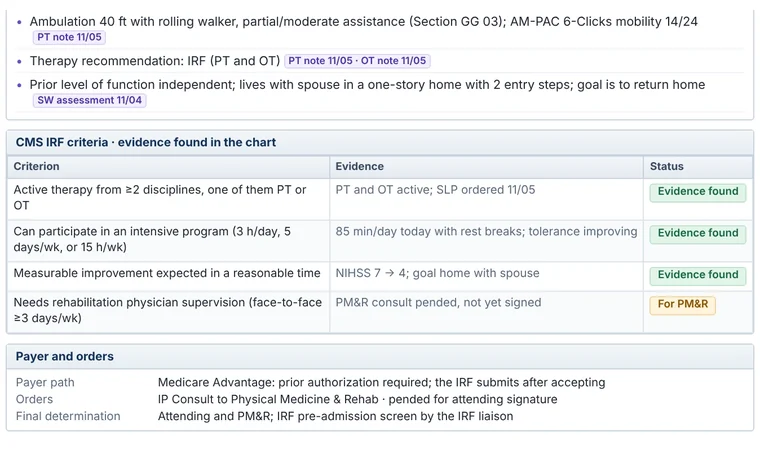 Criteria with evidence. Evidence found, or left to PM&R.
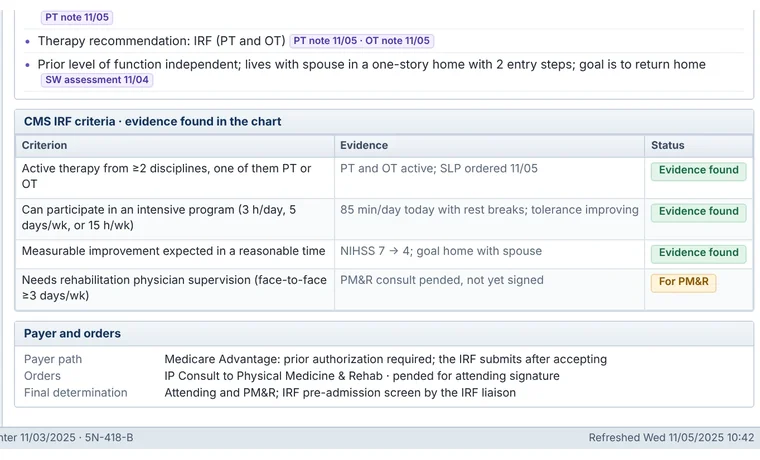 Payer path and orders. Authorization noted; consult pended to sign.
Step 3 of 6 · Case managers
Referral packet
The drafted packet holds what the IRF admissions liaison needs for pre-admission screening. Nothing is sent until the case manager approves.
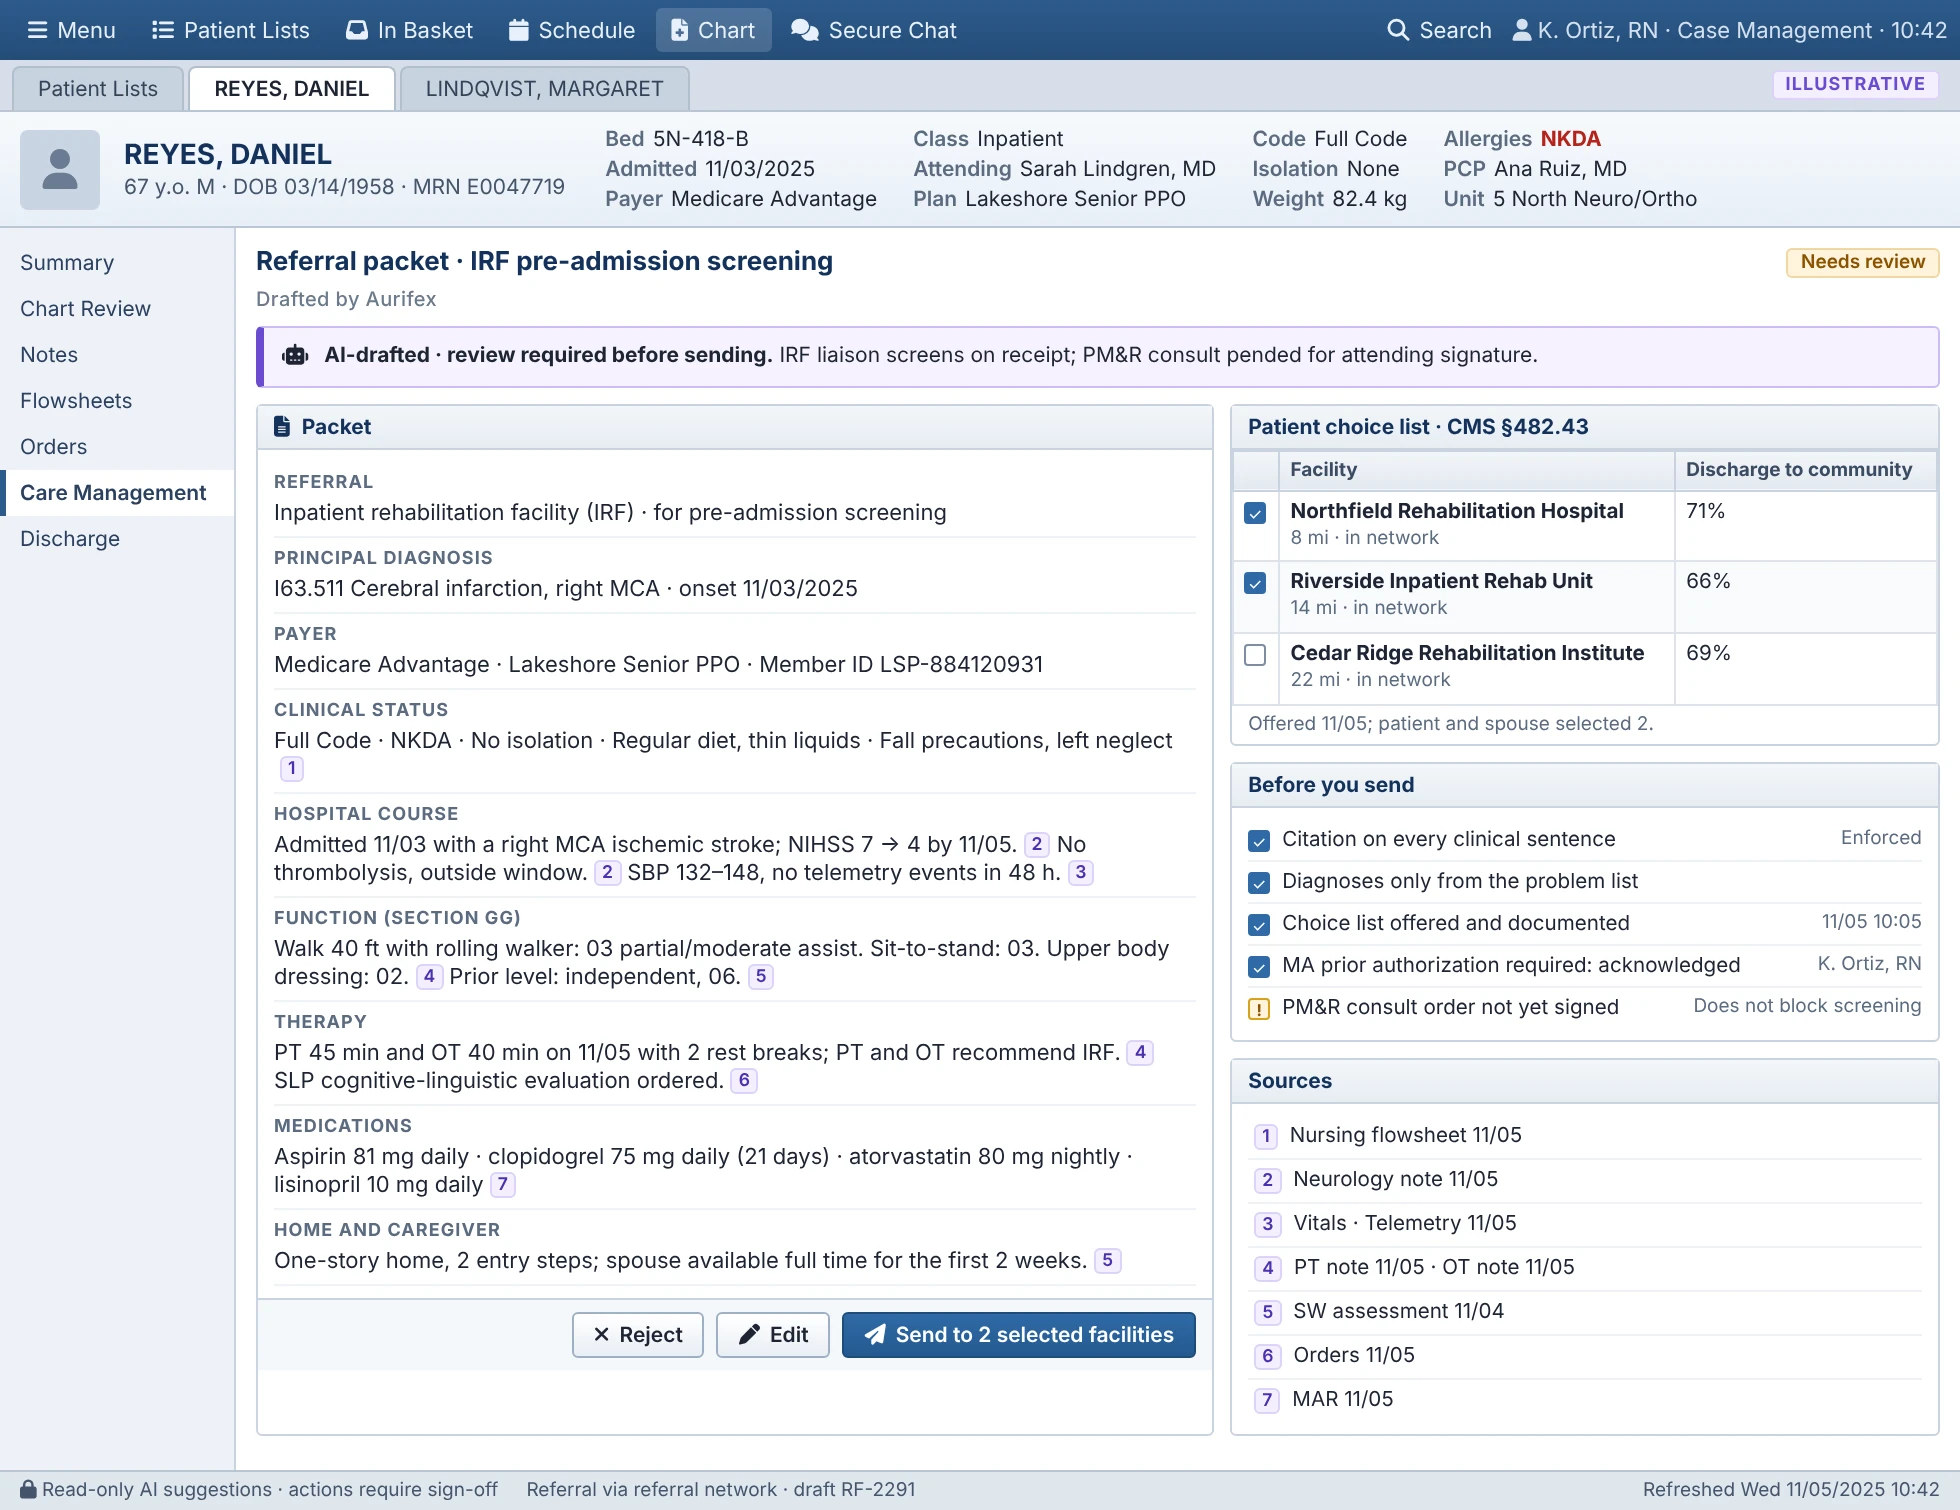
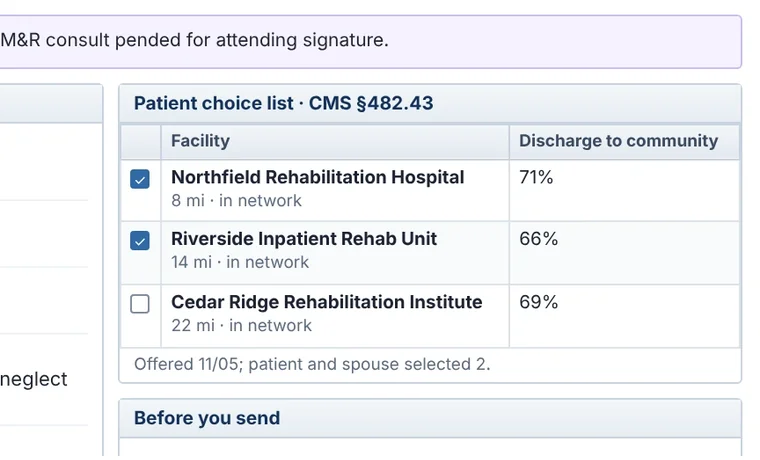 Patient choice list. IRFs with quality data (42 CFR 482.43).
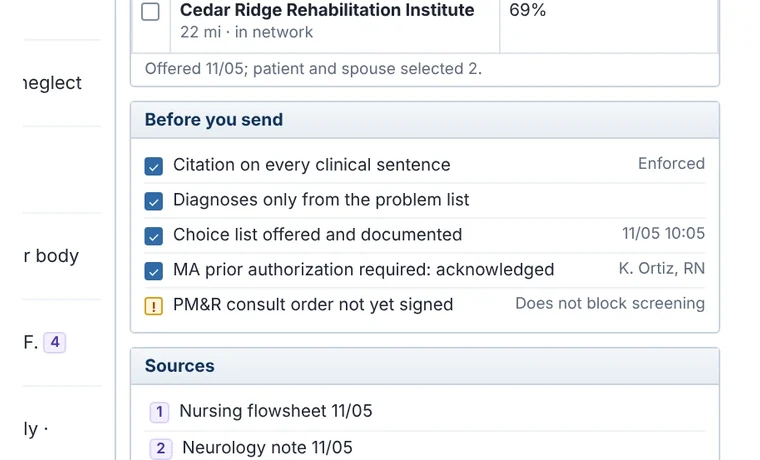 Checks before sending. Citations, diagnoses, choice list and authorization.
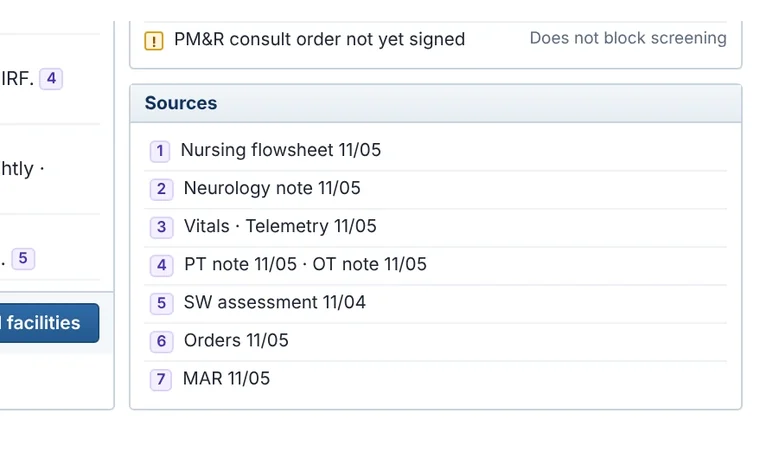 Numbered sources. Every clinical sentence cites a source.
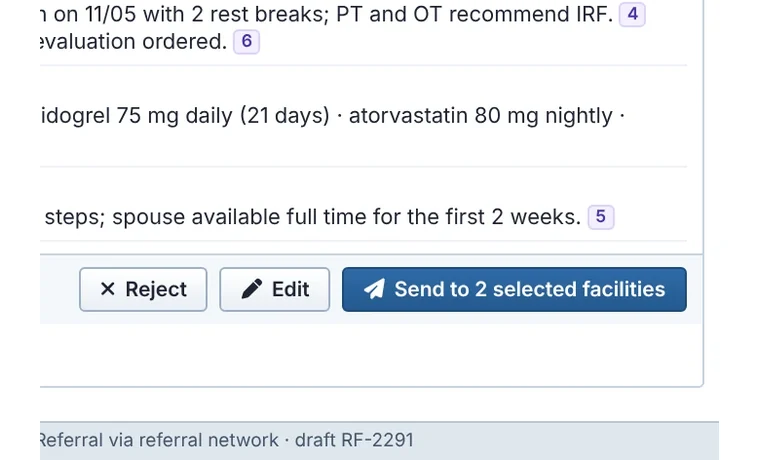 Send, edit or reject. Only to facilities the patient chose.
Step 4 of 6 · Unit leaders
Unit capacity
Huddles run from one view of expected discharges and every avoidable-day barrier.
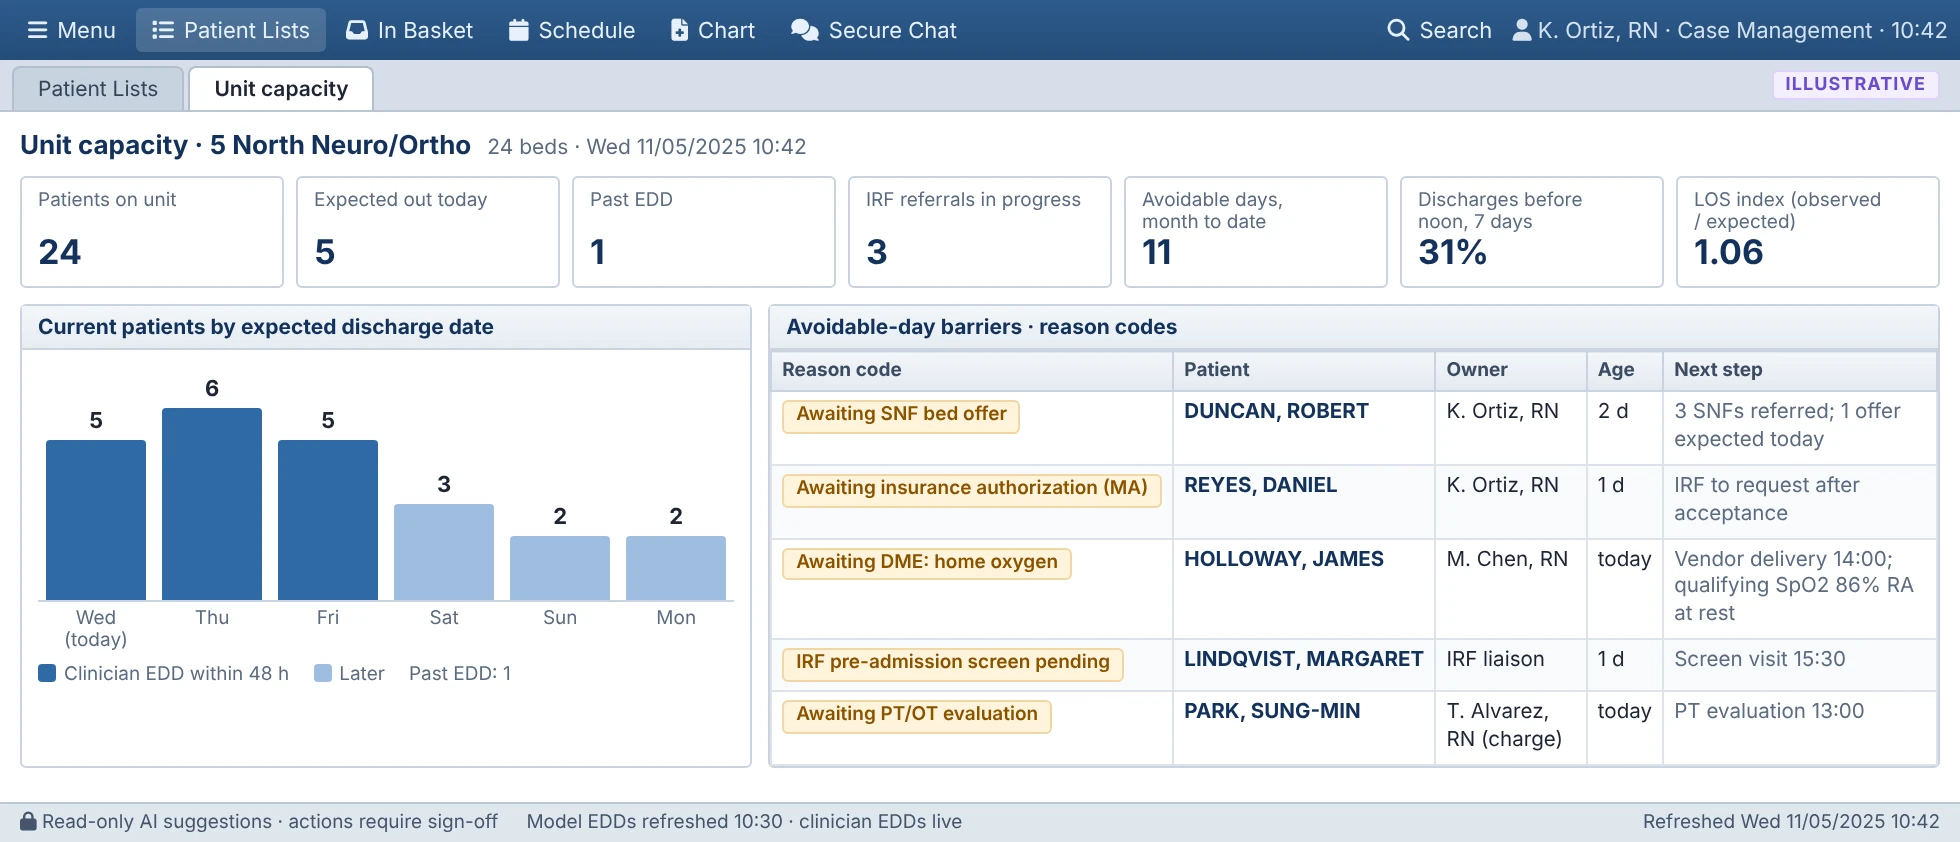
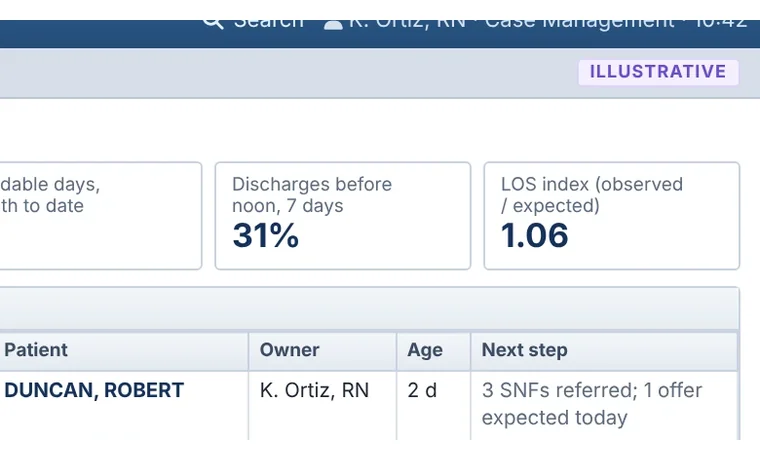 Length-of-stay index. Below 1.00 is shorter than expected.
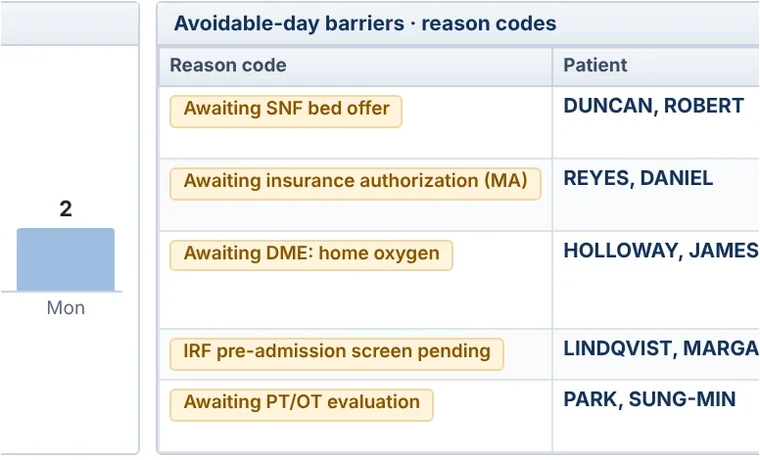 Reason codes. A standard reason for every barrier.
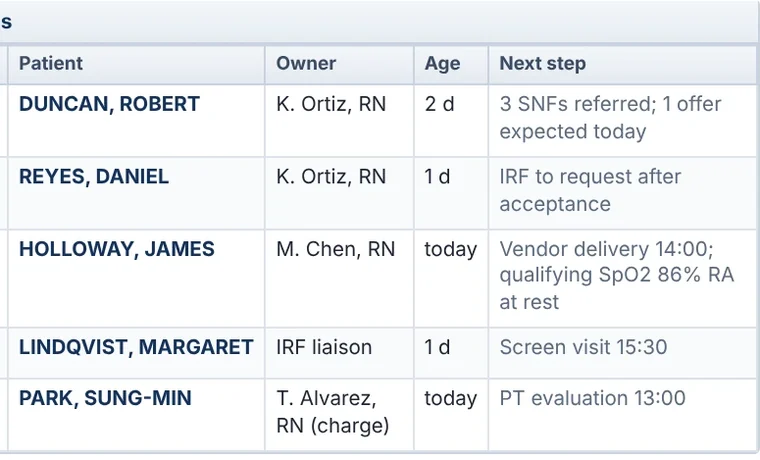 Owner and age. Who owns it, and days open.
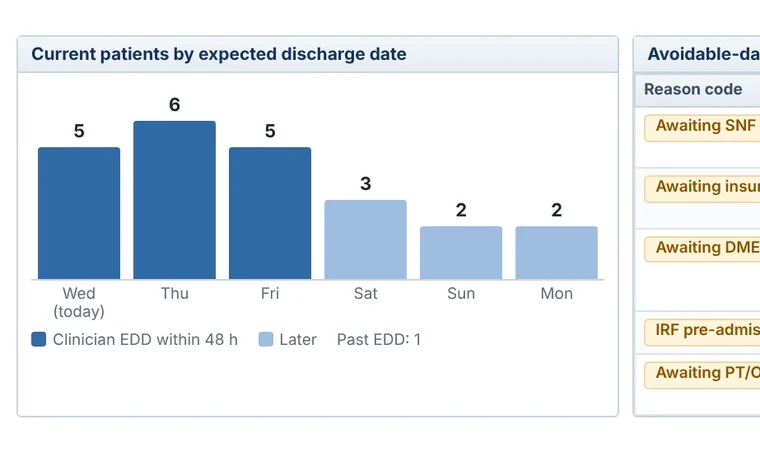 Expected discharges by day. Dark bars: clinician dates within 48 hours.
Step 5 of 6 · Clinician reviewers
Clinician review
Each week, clinicians review a sample of drafts and flags with patients hidden. Marked drafts are reviewed with you weekly.
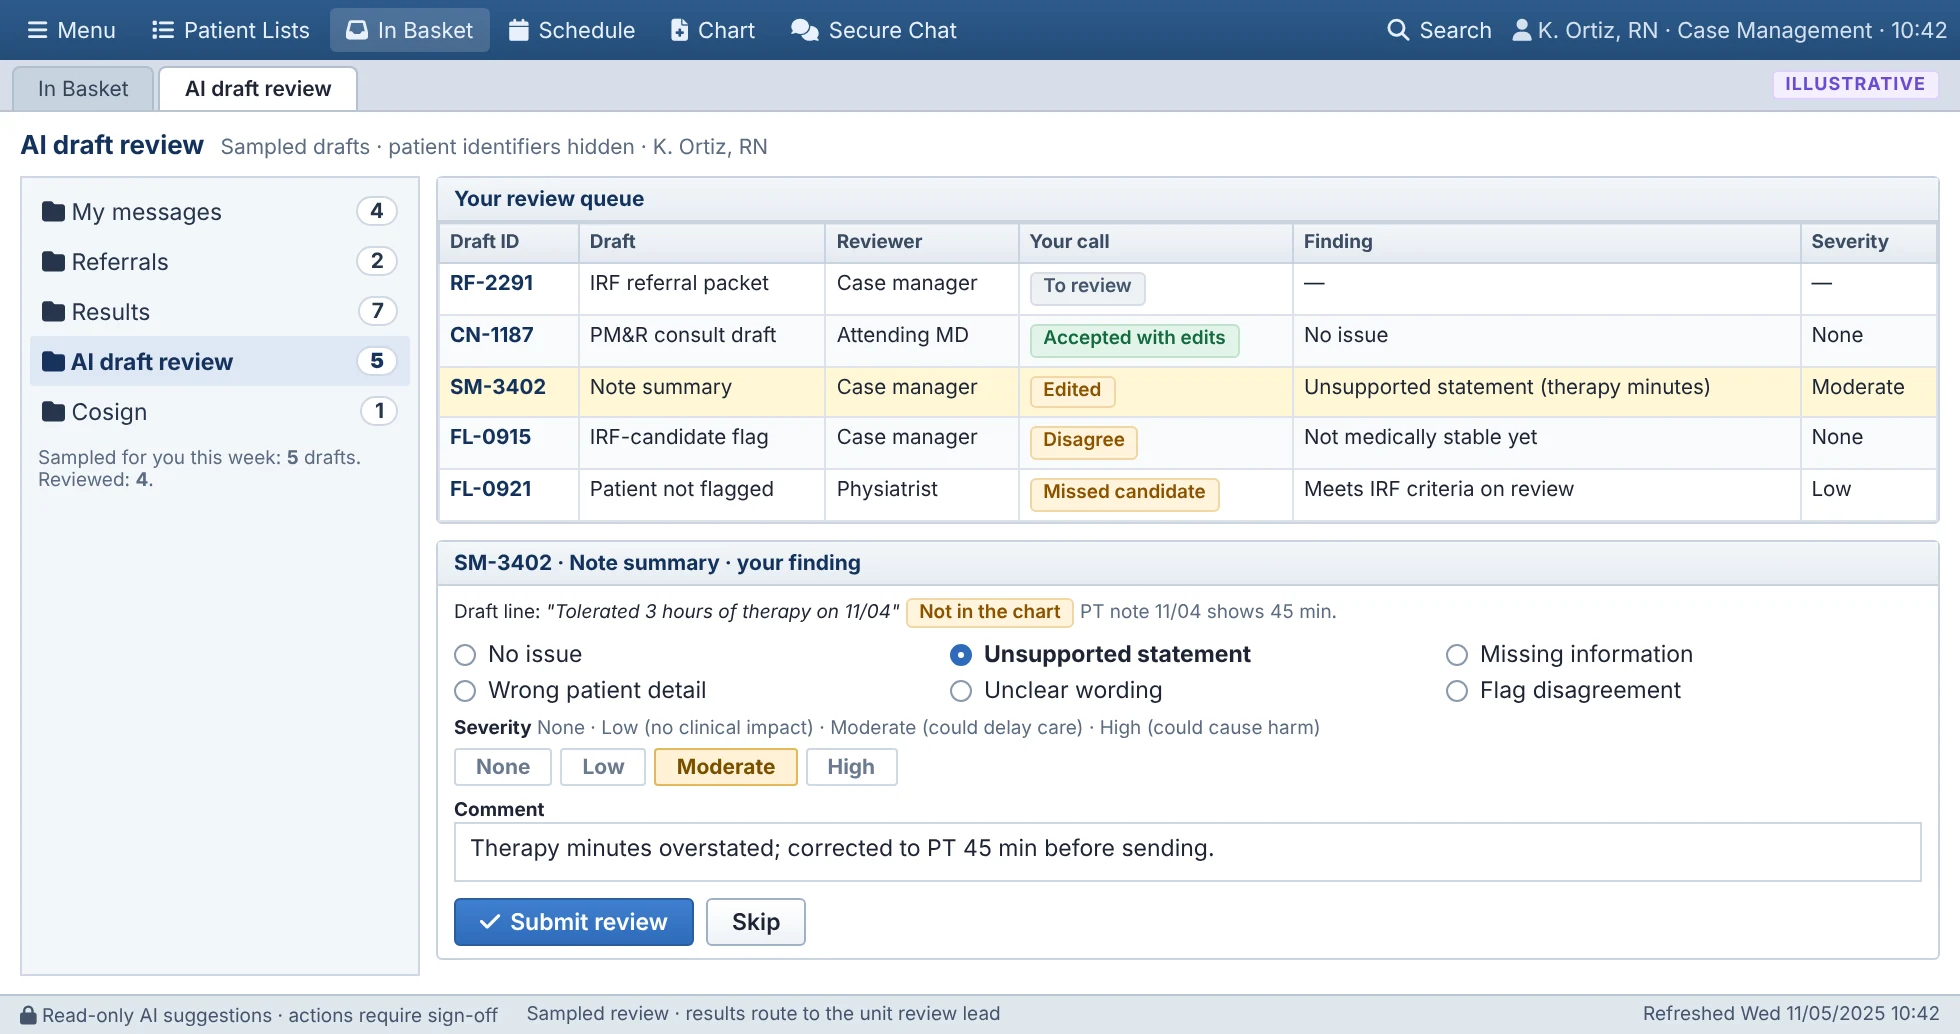
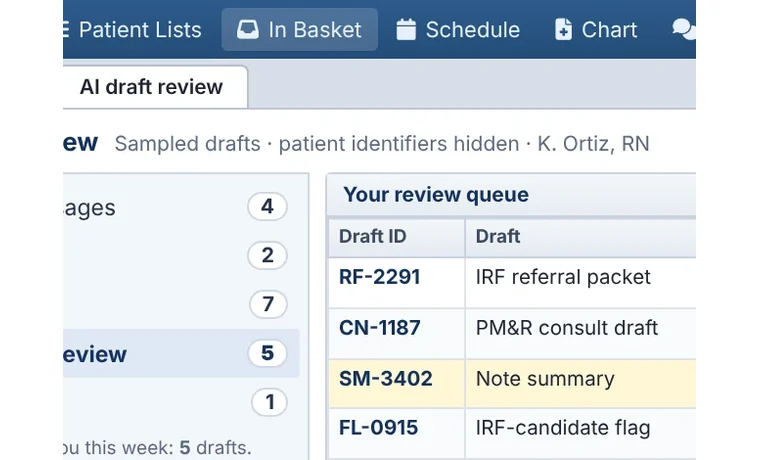 Patients hidden. Draft IDs only.
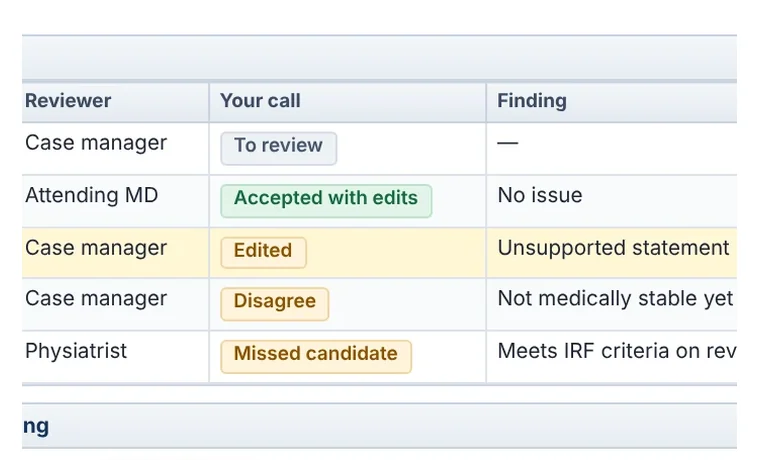 The reviewer's call. Accepted, edited, disagree or missed candidate.
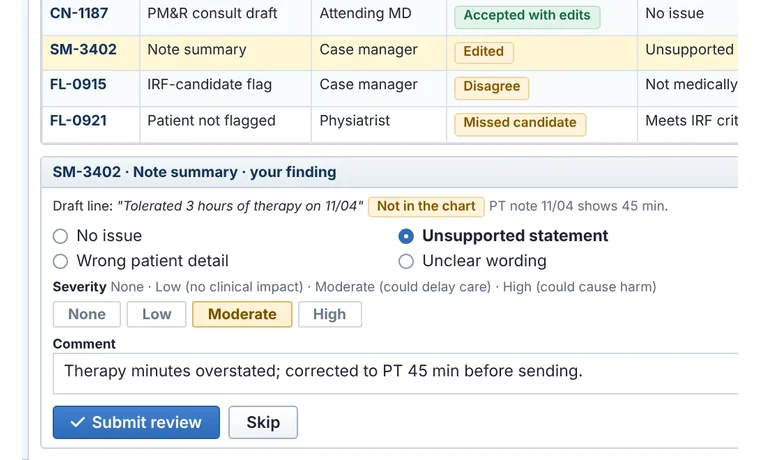 Not in the chart. Here, therapy minutes were overstated.
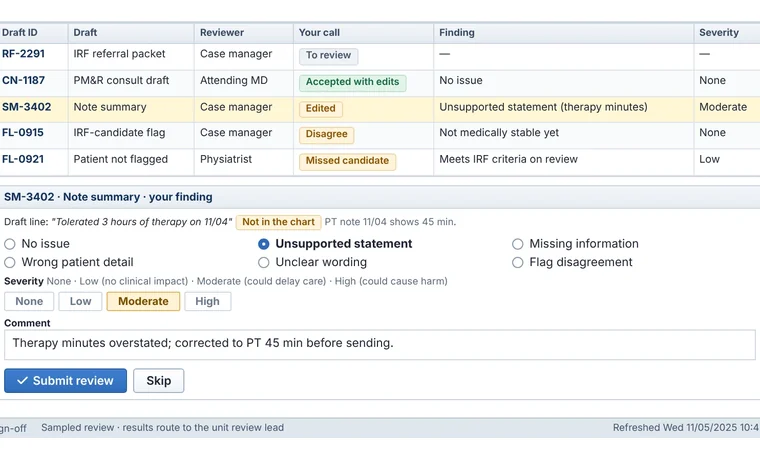 Severity. Most serious findings fixed first.
Step 6 of 6 · Executives and finance
Outcomes dashboard
Leaders see results against each unit's own baseline, adjusted for case mix, on a separate reporting site.
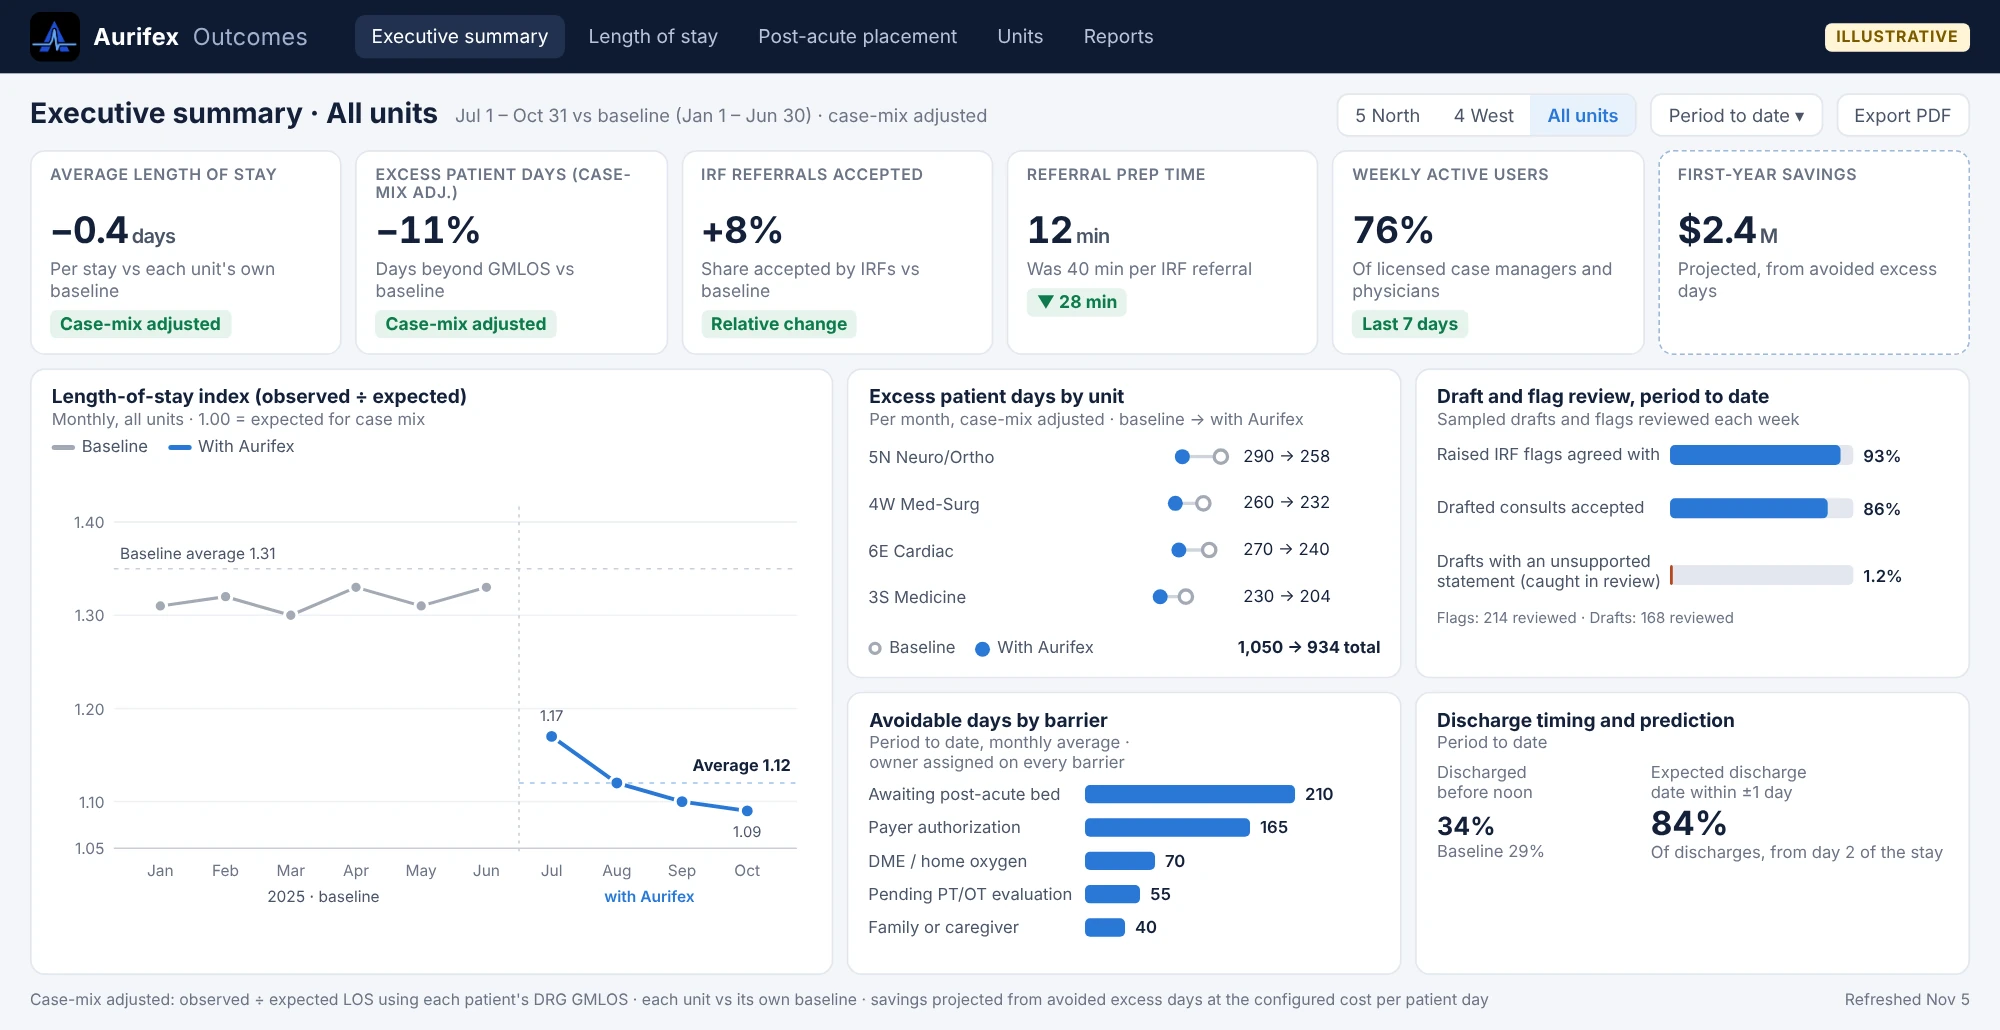
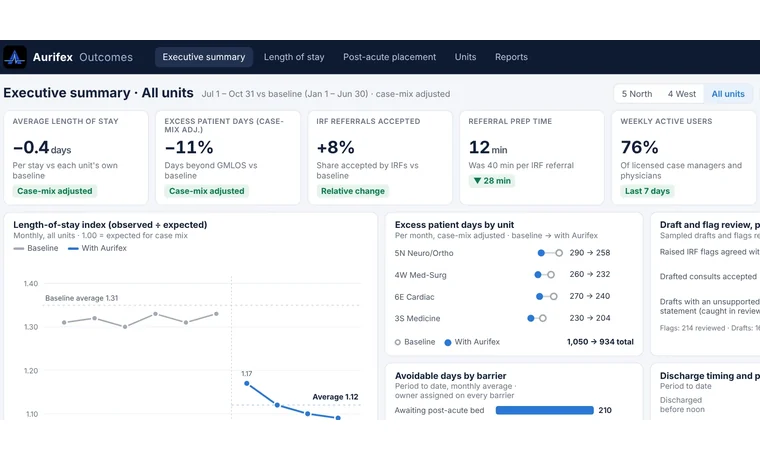 Against baseline. Current value, baseline and change.
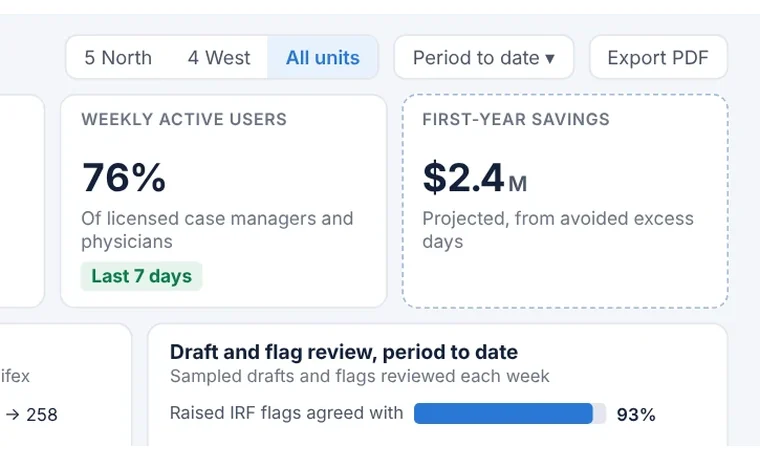 Savings labeled projected. Until your finance team confirms them.
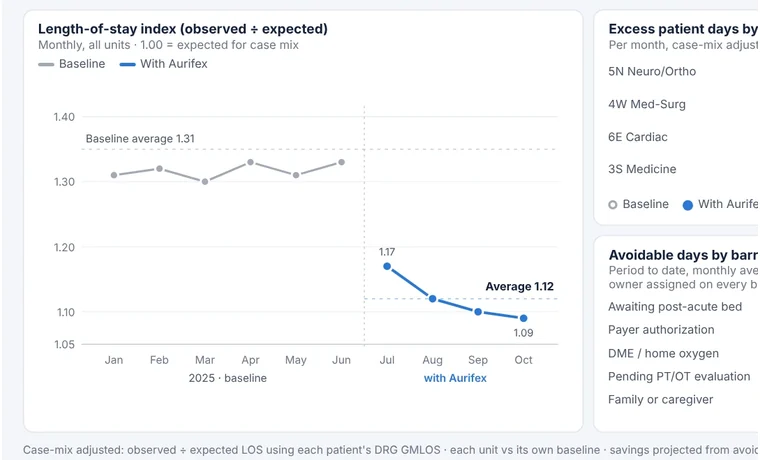 Length-of-stay index over time. Monthly, adjusted for case mix.
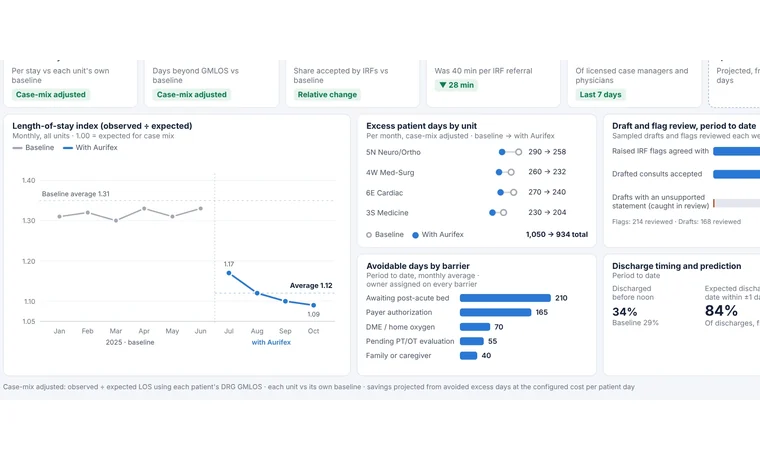 Method on the page. Printed with the results.